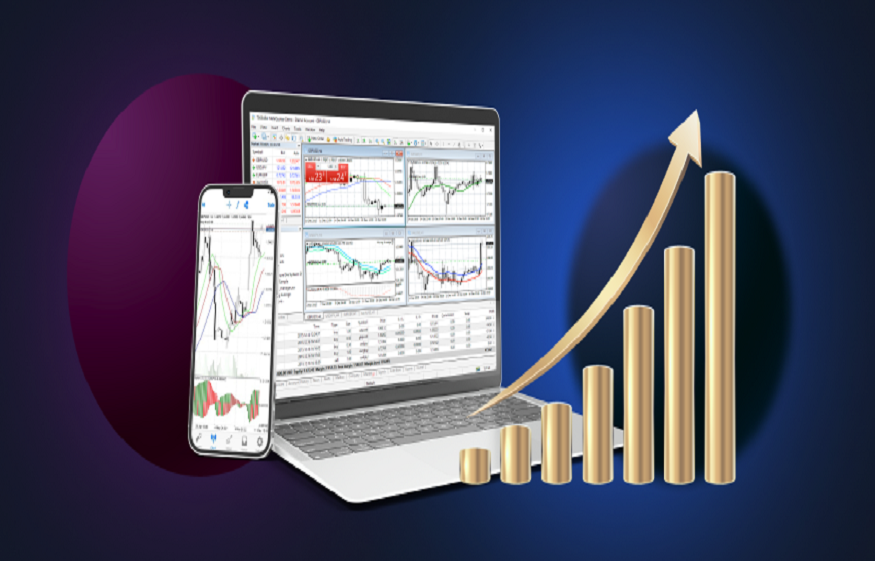
In the world of Contracts for Difference (CFD) trading, understanding price movements is everything. Unlike long-term investing, CFDs are often short-term and highly speculative, which means traders need sharp tools to make quick yet informed decisions.
Charts and technical indicators form the backbone of this analysis, offering a way to interpret market behaviour, identify potential entry and exit points, and manage risks effectively. Without these skills, CFD trading becomes more of a gamble than a calculated strategy.
Understanding the Basics of Chart Reading
At its core, chart reading is the practice of interpreting market price movements to understand past behaviour and forecast potential future trends.
Instead of relying solely on fundamental news or speculation, traders use visual price data to spot patterns that often repeat themselves. In CFD trading, this skill becomes even more valuable since contracts derive their value from the underlying asset without requiring ownership.
Many traders use platforms such as ADSS UAE, where advanced charting tools and technical analysis features help them navigate volatile markets more efficiently. Whether you are analysing forex, stocks, commodities, or indices, charts give you the language of price action that every trader must learn to read.
Common Types of Charts in CFD Trading
Charts come in different forms, each providing unique insights. Line charts are the simplest, plotting only closing prices over time. They give a clear overview of the general direction but lack detail. Bar charts go a step further by showing the opening, high, low, and closing prices of a trading period, offering more information on volatility and price ranges.
Candlestick charts, however, dominate CFD trading because they present price data in a visually intuitive way. Each candlestick represents a period and reveals the battle between buyers and sellers.
Patterns like dojis, hammers, or engulfing candles often indicate potential reversals or continuations, making them indispensable tools for traders who rely on short-term price action.
Key Components of Price Charts
To understand charts deeply, it’s important to know their building blocks. Prices are typically recorded as open, high, low, and close (OHLC), which describe how the market moved within a timeframe. From these values, traders identify support and resistance levels, which represent price points where the market has historically struggled to move below or above.
Trend lines are another critical element. By connecting price highs or lows, traders can visualise whether the market is in an uptrend, a downtrend, or moving sideways. Channels add another layer, showing parallel ranges where price oscillates.
Volume is equally important, as it measures the strength of a move. A strong rally with high volume signals conviction, whereas low volume may indicate hesitation.
Introduction to Technical Indicators
While charts tell the story of price action, technical indicators add context and deeper analysis. Indicators are mathematical calculations applied to price data that help traders measure momentum, volatility, or trend direction. Some indicators lead by predicting potential price movements, while others lag by confirming existing trends.
It’s tempting to load charts with multiple indicators, but this often leads to confusion. Instead, the most effective traders select a few complementary tools to validate their strategies without clouding their judgment.
Popular Technical Indicators for CFD Trading
Among the most widely used indicators is the moving average, which smooths out price fluctuations to highlight the overall direction. The exponential moving average (EMA) reacts more quickly to recent price changes, making it useful for short-term CFD trades.
The Relative Strength Index (RSI) helps determine whether an asset is overbought or oversold. When the RSI reaches extreme levels, it may signal a possible reversal. Similarly, the Moving Average Convergence Divergence (MACD) tracks momentum shifts, often used to confirm the strength of a trend.
Bollinger Bands measure volatility, expanding when markets are highly active and contracting when they quiet down. Breakouts beyond the bands often signal strong price movements. The stochastic oscillator works in a similar way to RSI, helping identify when momentum is fading and a reversal might be near.
Combining Charts and Indicators Effectively
Charts and indicators should never be used in isolation. A candlestick pattern may suggest a bullish reversal, but pairing it with an RSI reading that confirms oversold conditions strengthens the signal. Similarly, using moving averages alongside MACD provides a more reliable perspective on trend direction.
The key lies in building a balanced system where indicators confirm what the price chart already suggests, rather than contradict it. This way, traders reduce the risk of false signals and improve their decision-making accuracy.
Conclusion
Mastering charts and indicators is not optional in CFD trading—it’s essential. These tools provide the framework for understanding price behaviour, identifying opportunities, and managing risks effectively. By combining chart reading skills with a disciplined approach to technical indicators, traders can move away from speculation and toward informed decision-making.
Ultimately, the key to success lies in balancing knowledge, patience, and practice. Charts and indicators are powerful, but only in the hands of those who take the time to study and apply them consistently.
